It is possible to be given two charts together in IELTS writing task 1. Below you will see two pie charts followed by a bar chart. This exercise will focus on how to structure your report and how to highlight the key features of both charts in one overview.
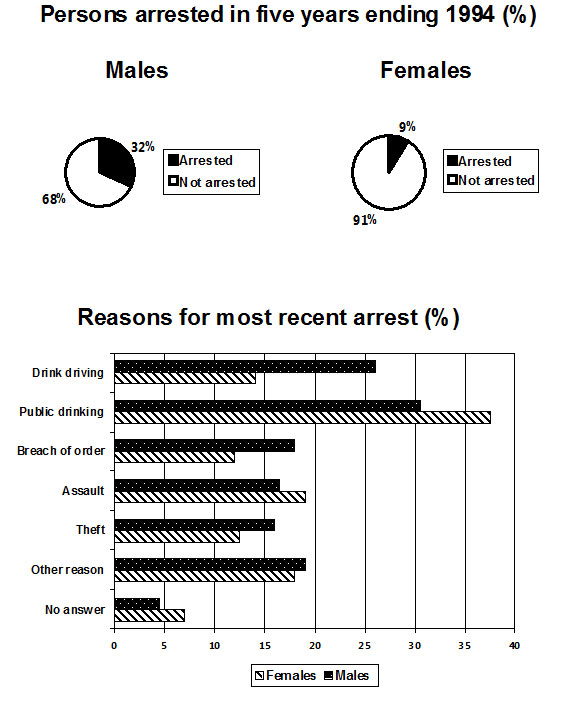
The charts below show the males and females arrested over 5 years and the reasons for the most recent arrests.
Source: The above charts were not created by IELTS Liz.
Two Charts: Structure and Overview
Answer the questions below in order to decide your paragraphing for your task 1 report.
- Will you put the introduction separately?
- Will you have an overview or conclusion?
- How many body paragraphs will you have?
- What order will you put your paragraphs in?
- Will your body paragraphs be equal lengths?
- Yes, the introduction should go in a separate paragraph.
- You must have an overview not a conclusion. The overview can go after the introduction.
- You should have 4 paragraphs in total.
- You should have an introduction, an overview, one body paragraph for the pie chart detail and one body paragraph for the bar chart detail.
- The body paragraph with pie chart detail will be shorter than the body paragraph with details about the bar chart
Now write your overview. this paragraph must contain key features from both charts. This means you must write one sentence about the key features of the pie charts and one sentence for the key features of the other chart. After you have written your overview, check the sample overview. Model Overview
Overall, over the five year period finishing in 1994, there were significantly more males arrested than females. The majority of arrests were due to public drinking while no answer was given for the least number of arrests for both genders.
Recommended
- Pie chart lesson in easy steps – a complete report, click here
- Bar chart model: Band 9
- Pie Chart Model: Band 9
- How to Describe a Bar Chart: Essential Tips Video Tutorial


Hi Liz,
Greetings.. you are a great teacher i have learnt so much from your website… but i am bit confused regarding use of bracket in writing task 1 to explain data likewise electricity generated from thermal was higher(27%) than renewals(10%). I am going to give exam on 1st june please clear my doubt… and kindly wish me gud luck its my ist attempt in IELTS
It’s fine to use brackets in your writing task 1 report. But don’t over use them. Make sure you use a range of grammar structures and language. Lots of luck!! See this page for all writing task 1 tips: https://ieltsliz.com/ielts-writing-task-1-lessons-and-tips/
Hi Liz,
First, I would like to thank you very much for this great effort you are putting here. The content id definitely helpful for everyone who would like to improve their scores in the IELTS test. I have written my response to the above chart and would appreciate your feedback:
The pie chart illustrates the percentage of males and females who were arrested from 1989 to 1994 while the bar graph gives more information about the reasons for their arrests, breaking it down into seven different categories.
Overall, the proportion of males who were arrested over five years was significantly higher than that of their females’ counterpart. The biggest reason behind males and females’ arrest was drinking in public as opposed to having no answer for an arrest which accounted for the least percentage.
Total percentage of people arrested was 41% with males representing 32% and just 9% for females. In terms of males, drinking in public scored the highest reason for arrest at just above 30% as opposed to the people who chose not to answer which was the lowest at approximately 4%. The second highest reason for male arrests was drinking driving at slightly over 25% while the remaining reasons had almost similar proportions scoring an average of about 17%.
Similarly, the most popular reason for females’ arrest was public drinking which reached a peak of just over 30%, accounting for six folds of no answer (just below 5%). Apart from that, drink driving, breach of order and theft consistently accumulated almost the same percentage of about 13%. Furthermore, reasons for people who were convicted for assault and other reasons showed an average rate of just below 20%.
Please check it for me.
The charts provide the information regarding the proportion of arrests made by police over the five year period(1990-1994), and illustrate the causes of their latest arrests in terms of percentage.
Overall, majority of the males was involved in committing crimes as opposed to a small proportion of women. The drinking at public places was the most recent cause of the arrests of both genders. In contrast, few individuals were captured due to giving no response.
In regard to pie chart, it is conspicuous that about one-third of males had arrested as compared to only 9% of females over the five year period finished in 1994 according to the given data.
Turning towards bar chart, it is explicitly viewed that about two-fifth of women caught recently due to public drinking as opposed to around one third males arrested due to the same cause. Females dominated in assaulting cases and giving no answers with around 5% higher figure than their male counterparts. Males were showing two fold increase in arrests due to drink driving than females according to recent report. While, break of order and theft cases were demonstrated the same trends around 17%males’ and 13%female’s arrests. The arrests for no reason equally popular among both genders(well below than 20%).
HI LIZ,
Atfirst I want to tell you one thing ,thank you for being such an amazing person. I am sure if there were a nobel prize for best teacher, you would get it!
Another fantastic lesson, congrats for your great job.
Please share with us more essay topics. I am about to book my exam slot @march.
Need your help more.
Essay on summer vacation is it important or not ? like a positive aspect of spend time n summer time and side by side drawback also.
Hi,
It seems to me that it could be a good idea to construct 3 body paragraphs for this particular task (a, to comment about pie chart; b, to comment about crimes which lead to female arrest more frequently; c, for males ones). Could you comment if my reasoning is corect?
Thanks a lot
Cezar
A bar chart usually requires comparing. If you put males and females in separate paragraphs, you won’t be able to compare them.
Hello Liz,
Please, for this particular question, I wrote up to 211 words. Is it wrong to write above 150 words?
You should aim for between 160 and 180 words in task 1 – on the whole.
hi liz….i have got an exam on jan 9….this site is helping too much for me
to be true with you…..i have been love with you although i am younger than you..looking your videos on youtube
love you lizz
I’m glad my blog is useful 🙂 Good luck!
hlo mam m having exam on 16 july . I am having problem in managing task 1 length , i often exceed the give limit . plz suggest me how to ellaborate all the data given without increasing length, moreover give me some reading tips too.
thanku
You are supposed to select information, not just relate it all. Start learning how your writing is marked: https://ieltsliz.com/ielts-writing-task-1-band-scores/
Hi Liz,
I was confused in the sentence “The majority of arrests were due to…”. I wonder if there is “were” or “was” here? Would you please help me?
Thank you in advance
https://ieltsliz.com/liz-notice-2015-2016/
Hi Tuan,
After “the majority……” verb could be either singular or plural. It only depends on the context. Here It has to be plural according to context.
Hope you got the answer ! For more information please search internet…
Dear Liz,
Difficult to write about all the reasons for recent arrest in the body paragraph, so is it ok to write about only the major reasons?
It stead of missing out categories, try grouping them together.
Liz
Hi Liz,
I would like to know if it is fine to describe some features that I did not put in the overview?
For example, I observed that there was a significant percentage difference in the reason of drunk driving between males and females. It I didn’t mention it in my overview, can I add this point later paragraphs?
Thank you!
When you choose your key features, you also consider the length of your report. This has both pie charts and a bar chart. So, best to choose about one key feature from each and then start the body paragraphs. Try adding your sentence and then count the number of words. It might be lengthy and time consuming – remember you only have 20 mins for this.
All the best
Liz
Hi Liz,
does this overview get good band or not?
Overall, the percentage of males was considerably higher than that of females. Most number of males and females ended up in the prison for public drinking whereas the least percentage was shown for no reason in both gender.
also i am confused between the use of ” than ” and ” than that of” in comparison.
Sorry I don’t mark writing. You can use both “than” or “than that of”.
Liz
Maam,
I wrote about 200 words in task 1 and it was comparison chart (pie charts and table)So,Please tell me would this thing affect my band score??
If your overview contained key features and your body paragraphs contained obvious details, then it should be ok. Some charts contain a lot of information and it is possible to write around 200 words. But it depends on the charts you get and how you write. Without seeing your writing and the charts, I can’t comment exactly.
All the best
liz
Dear Liz!
I love your site, I’m a frequent visitor. I was wondering if in this case would it be a good idea to add to the overview the sentence: “The biggest difference between female and male arrest was in drink driving. ” ?
Thank you for your answer.
It is often good to add the main difference in the overview. But it depends on how much detail there is to write in the body paragraphs. Here you can see we have both a pie chart and a bar chart to describe. That means we need to limit the length of the overview or the report will get too long. But it is your choice.
All the best
Liz
Thank you!
i want ask you how I can improve my writing skill because I always get just 4 score
Can you tell me please?? Because my exam in the next Saturday
With only a few days left, I recommend you look at my model essays and pay attention to structure, content of paragraphs and linking devices. However, to get more than 4, you will need to be able to produce more accurate English. More errors = lower score.
All the best
Liz
Hi Liz ,
Excuse me mum ,, in which time are you gonna read candidates` work ? ,, is there any particular appointment or when you are free ??
Thanks
Regards,
Sorry, but at present I do not have time to offer any free marking.
All the best
Liz
Dear Liz ,
kindly , can you read my introduction and overview ? . and could you please evaluate them ..
The pie chart depicts some information about the numbers of people from both genders who were arrested in five years , by the end of 1994 , while the bar chart illustrates seven features for why they were taken down.
Overall, men who had been arrested, exceed more than women in the same five years .However, the most popular cause for that detention , was the general drinking for males and females, whereas no reason was given for the minimal numbers of arrests.
Regards,
Please read my notice: https://ieltsliz.com/posting-writing/
Liz
Hello Liz,
Thank you for everything you did and you do
In task 1, if have for example pie chart and bar chart should i write an introduction for each ,then i start the body paragraph with the keys features for the both of them.
You introduce both in the introduction. You write the key features for both in your overview. Then you describe each in separate body paragraphs.
Hi Liz,
I wanna ask if we can put percentages or any information like numbers or years in the overview ? or it must be only in the body paragraphs ??!
Thanks,
The overview is just a description of the key features without details of numbers. Unless, you have totals to give, for example in a table. All details usually go in the body paragraphs.
All the best
Liz
okay
Thanks ,you are the best teacher 🙂