This lesson is to practice vocabulary for line graphs.
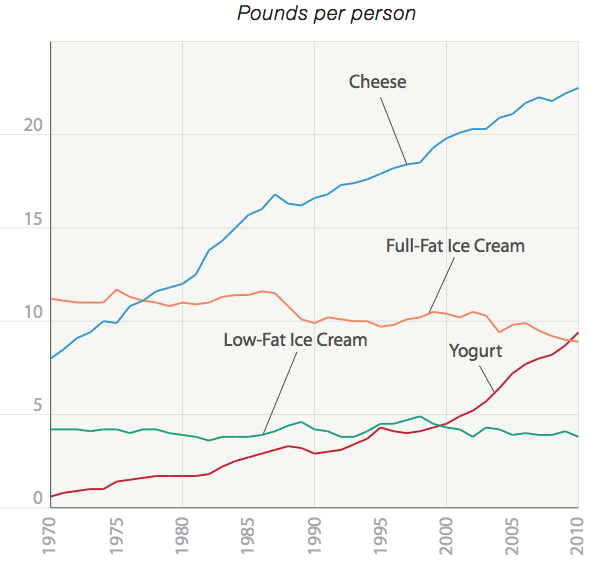
The graph below shows the consumption of four types of dairy products in the USA from 1970 to 2010.
Source: IELTS Liz did not design the above graph.
Questions 1-6
Complete the details using no more than three words for each gap.
The amount of cheese eaten by people from the USA (1)…………….. (2)…………………….. from about 7 pounds in 1970 to reach a (3)…………… of over 20 pounds in 2010. Likewise, the consumption of yoghurt (4)………………. from just over 0 to just under 10 pounds in the final year. There was (5)………………… in the amount of full-fat ice cream eaten of about 2 pounds to reach about 9 pounds in 2010. The consumption of low-fat ice cream(6) …………. at around 4 pounds over the period given.
Answers- rose / climbed / increased / went up
- steadily / significantly / considerably
- peak
- rose / climbed / increased / went up
- a decrease / a fall / a decline / a drop / a slight fall / a marginal decrease / a minimal drop
- fluctuated
Recommended
Main IELTS Pages
Develop your IELTS skills with tips, lessons, free videos and more.


hey Liz, it should be 12pounds, not 2 pounds in line 5 . I was wondered why the answer is decline 😂
The sentence is correct as it is written. The sentence is about the difference from start to finish. It started at around 11 and ended at about 9. So, this is a decrease of about 2 pounds. It is another way of presenting information instead of giving the start and finish amounts – give the difference (the change).
The chart presents a comparison of four different dairy product (i.e. low fat ice-cream , yogurt, high fat ice-cream and cheese) consumed in USA during the period of 1970 to 2010.
Overall, the graphical trends displays a gradual rise in the usage of cheese and yogurt over the period of 40 years. The consumption of full fat ice cream and low fat ice cream shows a stablizing trend with a dip towards the end of this period.
In 1970, Full fat ice-cream was the leading consumed dairy product, at 11 pounds per person, while low fat ice-cream was used at half of that rate. Cheese was consumed at the rate of 8 pounds per person while yogurt is least used dairy product with only 1 pound per person consumption rate.
By the end of this 40 years period, cheese usage depicts a gradual rise to 22.5 pounds per person followed by yogurt, at 10 pounds per person. Full fat yogurt and low fat yogurt shows a fluctuation in the graphical behavior of their consumption with leads to a narrow decline towards the end of whole period reaching 8 pounds and 4 pounds per person respectively.
plz check for vocabulary and grammer. tia
The line graph illustrates the amounts of four different dairy products(cheese,yogurt,full fat and low fat ice cream)consumed per person over a period of 40 years from 1970 to 2010 in the US.
overall,the consumption of cheese and yogurt increased significantly over thid time period whereas that of full fat ice cream showed a declining trend wih low fat ice cream consumption remaining static.full fat ice cream was eaten in highest amounts in 1970 only to be replaced by cheese in final year.
The consumption of cheese rose steeply over 40 years from around 7 pound per person in 1970 to around 23 pounds per person in 2010.with only negligible amounts consumed in 1970,consumption of yoghurt showed a gradual increase reaching just under 10 pounds per person in final year.
with few fluctuations,amount of low fat icecream consumed remained more or less static at around 4 pounds per person.The consumption of full fat ice cream showed a marginal decrease of around 2 pounds per person to reach about 9 pounds in 2010.
you wrote well means in a prescribed manner.
Hi Liz,
Thank you very much
Great work 🌹
Hi Liz,
Can we use past perfect continuous tense instead of part tense in describing this kind of line graph (which the periods happen in the past). For example, can we use:
“Overall, both the consumption cheese and yogurt had been increasing over the period given”
instead of
Overall, both the consumption of cheese and yogurt rose decreased over the period given.”
Thx 🙂
You use “has been increasing” if the increase is still happening today. Does this graph show that it is still happening in 2017? Check your use of grammar tenses.
Thank you so much Liz for your great lessons,my exams will be on September 30th and I got lots of ideas from your blog.
Good luck!
Hello Ma’am,
Your blog is really a great help as well as your videos. I’ll be writing my IELTS exam soon.For this practice i have a question,
Is it fine to consider writing “The amount of cheese eaten by people from the USA progressively increased from about 7 pounds in 1970….in 2010” instead of writing “increased considerably” or should it be “progressively increased”?
pls reply at the earliest
Thank you Alot!
I would use different paraphrases:
increased significantly
increased steadily
Alright thank you ma’m !
hi liz, in the Overall can we consider this paragraph as Key Features : ” the amount of cheese consumed by people more than that other three kinds ( …… ) of dirty while over the period given. “
*as one of Keys Features
You’ve missed the verb out of your sentence: “The amount of cheese consumed WAS more than …” Do you mean “dirty” or “dairy”
Hi, Liz.
What does “diary” have to do with this?
Sorry, I don’t understand.
Hi Liz,
Thank you for your help. Could you tell synonym for consumption in this case?
TIA.
You can see the synonyms used in the gap fill above.
Hi , Liz
I wanted to ask if in situation when there is one or two line but its fluctuating it goes increase then decrease and this process is rapidly repeated over different period in this case what is the best way to write about these types of graphs?
https://ieltsliz.com/ielts-liz-news/
Great work
Miss
thanks alot
Hi Liz,
Just want to say thank you for sharing your blog to us. I can only imagine how effort you exerted into this blog to help us people from different parts of the world improve our IELTS skills. I admire that kind of patience that you have, most specially in trying to get back on our ‘bloody’ list of questions . You’re an amazing one of a kind mentor.
Regards,
Joharra
You’re welcome 🙂
liz thank you so much your blog is very helpful for me.
You’re welcome 🙂
Hi Liz
I realy find your website very helpful , but I have question about line graphs and task 1 in general
I always sruggle with which type of tense I should use especially when the period in graphs over past , now and future. What is the best way to overcome this challenge?
Thanks…
You use past when you are given dates in the past. You use present when there are no dates. You use future when you have future dates.
All the best
Liz
Hi Liz,
I would like to ask, what is the numbering count for ‘full-fat ice cream and low-fat ice cream’?
Do i count them as 3 words?
Thank you in advance 🙂
“low-fat” is counted as one word.
Liz
Hi Liz!
Thank you for your helpful free tips and lessons that you’ve provided for all of us.
<3
You’re welcome 🙂
Hi mom !
First of all I want to thank you for providing such valuable lessons.
However, as far as I know that in line graph presenting ,usage of passive tenses and perfect ones are not allowed. Could you please explain it a little bit more??
Thanks in advance !
You should use the grammar tense that is grammatically correct and appropriate for the information being presented. That might be the passive voice or a perfect tense depending on the context. However, the most common time to use the passive voice is with diagrams.
All the best
Liz
hi Liz
I have a question
do these sentences mean the same ?
there was a decrease of 2 pound
there was a decrease by 2 pound
They mean the same but the grammar is wrong in one. The first one is correct but the second one should be written “it decreased by 2 pounds”. One sentences uses a noun “a decrease” and the other uses a verb. They both relate to the amount of the actual decrease.
Liz
dear liz
thanks a lot for your great effort. it is really helpful.
how do you see this sentence:
The consumption of yogurt surpassed full fat ice cream and low fat ice cream in 2005 and 2010 respectively.
best regards
Got it…Thanks…
I have my IELTS exam after two days, but I am still not confident in writing task 1 and 2.
I need band 7…hope something works!!!!!!
Many Thanks..
Hi Liz,
Thanks for the simple explanation,it really helps..
I have my Ielts-Academic on 18th of June.
Q5. There was a decrease in the amount of full fat ice cream eaten of about 12 pounds….its mentioned 2 pounds..
Thanks..
The amount did not fall by 12 pounds, it went from about 11 to about 9 which means it fell by 2 pounds. Don’t forget that “by” means the amount of the change.
All the best
Liz