This is a model answer for an IELTS writing task 1 table of future predictions as well as past information. This type of writing task 1 requires you to use both past tense and future forms in order to present the information accurately. Download the free pdf copy of the table and answer: IELTS Table Future Prediction Model Answer
Model Answer with Future Predictions
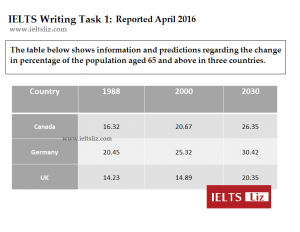
The table gives information about the proportion of the population who are 65 years old and over in 3 countries (Canada, Germany and the UK) in 1988, 2000 and an estimated percentage in 2030.
Overall, the population of elderly people is predicted to rise in all three countries from 1988 to 2030. The highest percentage of older people was in Germany, which will continue to remain the highest in 2030, while the lowest proportion can be seen in the UK over the period given.
Between 1988 and 2000, the aging population of Canada and Germany went up by around 5% to 20.67% and 25.32% respectively. The UK, on the other hand, showed relatively little change in the proportion of its population aged 65 plus and remained at just under 15% in both years.
By 2030, it is expected that the population of people aged 65 and above will increase by approximately 5.5% in all three countries. The percentage is forecast to reach 30.42% in Germany, 26.35% in Canada and 20.35% in the UK.
Recommended for IELTS Writing Task 1
- Paragraphs & Structure
- Conclusion or Overview: Tips & Advice
- How to Describe an IELTS Bar Chart
- Band Score Tips & Summary for WT1
- Pie Chart Model Answer
- All Model Answers, Tips & Advice for IELTS Writing Task 1
Main IELTS Pages
Develop your IELTS skills with tips, lessons, free videos and more.


hi lizz, your lessons are really efficient and I am trying to write writing task 1 thanks to you. can you check my writing, thank you in advance.
The table illustrates us information and expectations about the proportion of people who are 65 years old and over of population in three various countries in 1988,2000 and 2030.
Overall, what stands out from the table is that Germany had the highest rate of people who were 65 and over also this rate will be expected to increase from 1988 to 2030.on the other hand the least percentage of people who are 65 and over were in the UK .also percentage of elderly people are increased slightly in the UK when compared to Canada and Germany.
When examining exhaustively, Germany has been shown the highest increased rate from 1988 to 2030. In 1988, the highest percentages of people who were 65 and over were in Germany with 20.45% while the least rate in the UK with 14.23%. when it comes to 2000, the country which was shown most increased was Germany and Canada approximately %5 and these countries reached to 25.32% and 20.67% respectively.
It is predicted that people who will be 65 years and over in Germany will increase to 30.42% in 2030. But the significant rise will be seen in Canada from 20.67% to 26.35%,in The UK from 14.89% till 20.35% between 2000 and 2030.
The table illustrates both the recent and projected change of gerontologic age of 65 and above in Canada, Germany and the UK from 1988, 2000 and 2030. Overall, every nation shows a rising trend and germany remained consistently as the peak in rapid growth of aged population both before and in the future; followed by Canada and the UK.
The senile population in Germany started at 20.45% in 1988. This figure rose to a quarter cumulatively in the year 2000 and 2030 with proportions of 25.32% and 30.42% respectively. Furthermore, Canada continued the second place, with an aged population of 16.32% in 1988, and is predicted to be so in 2030 with an estimated rise of 10.03%.
The UK, on the other hand, started with a population of 14.23% and had the shortest leap in the year 200 with around 0.66%. It is seen that the UK remained as the nadir in the entire time and will be so in the future with above 5% estimated rise by 2030.
Hii Liz ,In the last paragraph end ,you mentioned “the UK” but not mentioned “the CANADA and the GERMANY ” Can i know the reason ?
Because it is grammatically incorrect to use “the” in front of the words “Germany” and “Canada”. Check in your grammar book which countries do and don’t use “the”.
Thanks a lot Liz…
Hello, Liz. I want to thank you very much for a great work you are doing for us, wishing to help us with preparation for an exam. I want to mention some mistakes in one of the table you used in your list of diagrams for the task 1. Its the second table sample with the proportion of income spent for 4 common items in UK in 1998. There is a wrong amount for adults for electrical equipment (it should be 5,5%), as well as for children (11,5%), and videos for children could not be 12% but 17,5%. If I am wright, and the table is incorrect, may be it is worth to write some note to inform students? I understtand that they all are not made by you, and all of them were used in real IELTS at some point. So, the students should be prepared, that it might be incorrect information given in a table, but they will be able still to do the task 1 writing, trying to avoid mistakes and contradictions. I am sorry to write it here and not on the page itself, but there is no comment section.. Wish you all the best and once again thank you for your great effort!
IT is not your task to decide if the data makes sense. It is not your task to add up or subtract. It is not your task to do anything except report what you see as it is given. It is not your task to provide an opinion. It is a report which is based on data given, not interpretation of data.
hi Liz,
Do the words in the bracket also add up to the total word limit for Essay 1 and 2.
Yes. ALL words are counted.
Hi Liz, I came across a video (not yours) which advised against writing any conclusions, opinions and the likes. Can you please clarify when and when not to include this paragraph.
Writing task 1 is not an essay. Essays have conclusions which summarise the points already given – it repeats them. Writing Task 1 is a report – a short factual report. It does not include your opinion – it is factual – you report what you see. It should contain NO repeated information which means no conclusion. However, it must contain an overview which gives a collection of the key features so the reader can get a grasp on the main content.
I have my ielts exam tomorrow.wish me good luck.Your lessons are so helpful 🙂
Thank you Liz.
Good luck 🙂
Hi Liz, how much do you charge to review a writing essay? thank you
I don’t currently offer that service.
hay liz,
everybody said to me that overall should at the end in writing task 1
but your sample answers on this website,there are overall always in 2nd paragraph
so is it right ? if i write overall in 2nd paragraph…my exam on 5th Jan
There are no rules about this in IELTS. Both places are accepted 100%.
Hi Liz, can you check this for me and give me some feedbacks, please.
There is a table showing information and prediction regarding the change in percentage of population aged 65. They were in three different countries (Canada, Germany and UK) in three different years (1988, 2000 and 2030).
Overall, you can seen from the table that the highest number will be Germany in each years. On the other hand, the lowest number was in UK in each years.
In 1988, the highest number was in Germany with exactly 20.45. The lowest number was in UK with almost 15. Taking year 2000 next, the largest number was approximately 25 in Germany. The smallest number was just under 15 in UK. Exactly 30 in Germany in 2030, while in UK was only 20.
Regards,
Tana
Hello Liz, Please is it possible to say in the first sentence of the overall of this equestion :
Overall, in the Past, there was a gradual increase in the proportion of people aged 65, and it is expected to coninue rising in 2030.
Thank you in advance.
This is a minimal overview which would not give you a high score. You’ve included only one key feature. You need to mention more. Also mention that this applies to all countries. Furthermore, don’t use a capital letter for the word “past”.
Many thanks for your qucik response .
Hello dear Liz, First of all i would like to thank you about your posting definitely it would be helpful in future likewise in past. Secondly, i would like to ask you where could i go, to find more examples related to task 1 writing including task 2 models answers as well material for practice:
i will be going through IELTS on 13/10/2018
Click on the appropriate section of the test on the RED BAR at the top of the website. You will find free lessons, model answers etc etc
Thank you very much, Liz!
I think my writing skills have been improved a lot by viewing your website and practising. The tips and model answers are really useful. My exam will come in 2 days and wish I could do well.😚
I’ll keep my fingers crossed 🙂
Hi Liz,
I have a query. In the above task, you dived the paragraphs such that the first one compared the trends from 1988 to 2000 for all three countries and the next one compared them from 2000 to 2030.
I was wondering if I can write in a way so that I compare each country over the three given years. For example, talk about the trends in Canada for all the years followed by Germany and the UK?
Thanks
When you get a table, you can choose to divide your body paragraphs by column, by row, or by distinguishing features. There’s no right or wrong way. When you look at this table, you can see that the UK was always lowest and Germany always highest. So, sure it’s possible to divide it by country. This is why you need to spend time planning your organisation before you start writing. Do you want to highlight countries rankings? Or do you want to highlight that all countries population increased and then later decreased. It’s a choice you make. As long as the examiner can easily understand your organisation (by using linking words and signposting), but ways are possible for the table above.
Hi Liz,
I gave my IELTS and got my results.
L-9
R-8.5
W-7
S-7
Overall-8
Thanks a lot for your help!
Very well done 🙂 Band score 8 is great 🙂
Hi Liz
I am not good at writing how can I improve this skill it is realy annoying for me please help in my home town there is not a good teacher to help me
Go to the main pages of my website. There are over 300 pages of free tips and lessons. The main pages are accessed through the red bar at the top of the website.
that might help because I’m not a good writer either? any prediction to what will be coming for the next test. February 1 2018? either a bar graph? chart?
No one can predict and you should not believe anyone who says they can predict the future.
Dear Liz,
Can we add this the word ” rose ” to the overview by saying this ( the population of elderly people rose and is predicted to rise in all three countries from 1988 to 2030).
Thank you very much 💐
Sure.
Thanks for sharing. May God bless you.
Hi Liz, thanks very much for the model answers. Just a question on the last sentence of this answer, I usually write “The percentage is forecasted to ….” should i used forecasted or forecast in this case?
You write “is forecast to” (without “d”). You can also write “is expected to” or “is estimated to” (with “d”)
Hi Liz
Thankew much for ur ideas for writing task 1 and 2
My exam is on 12th august 2017 hope for d good marks pray
Thankew
Make sure you review all tips and band score tips on the main pages:
https://ieltsliz.com/ielts-writing-task-1-lessons-and-tips/
https://ieltsliz.com/ielts-writing-task-2-band-scores-5-to-8/
If you need extra help for writing task 2, I offer advanced lessons: http://subscriptions.viddler.com/IELTSLizStore
Good luck!
Dear Liz,
I gave academic test on 24th of June in Sydney and writing task 1 was exactly the same as your model bar graph given above. The only difference was that it was in horizontal way.
Writing task 2 was
Scientists predict that computers will drive cars in near future.
What are the reasons for this?
Is this negative or positive development?
See how useful this website is? I will recommend all my fellow ielts students to go through each and every model answer and tips given by Liz. 3 times I got the questions which are here already. It is very helpful. It doesn’t happen every time but still you never know.
It’s certainly useful to follow recent topics for both writing and speaking 🙂
Hi dear Liz,
I’m Zahra, your website and most of its pages are great. I was confused about writing tasks before I visit this website, because every book presents a different and complex structure for writing. I think your strategy is more logical, clear and easy.
Thanks so much
Hi Liz
Your site is definitely a great source of learning.
I am just wondering about the last sentence in the essay above. Is it ‘forecast’ or ‘forecasted’?
I think you meant ‘forecasted’. Looking forward to hearing from you soon.
Oops, just found out.
It can be either forecast or forecasted, can’t it?
Thank you liz
Hi Liz , I am practicing writing task 1 from your given material and I found it way too easy to me , it’s just like I am doing some match calculation. It’s really awesome. I am loving this task practice n hoping the others will be same. Thankyou so very much
I’m glad you find the exercises useful 🙂
Hi,Liz
I am ragas from Nepal.I Found your ieltsliz.com very much effective.
Thanks alot.
sagar 😀
How I get to know that whether it’s past tense or present or future
Look at the dates.
Hi Liz ,you are a great teacher. I have to give my ielts on 30 July I don’t have time for joining ielts institute’s. I require band score 7. I’m only following your instructions
Hi Liz Thanks for sharing very useful information of exam. I am Gaurav from India preparing for IELTS General exam. Are writing and reading content would be same like Acedmic or it would be different.
This information is provided on the main pages for IELTS which you access through the red nav bar at the top of the website.
Dearest Liz
I would like to thank you from the bottom of my heart for providing materials/Videos for IELTS preparartion. I used your online material for all the modules. With God’s blessings I cleared my IELTS with overall 8, and each bands above 7. Thank you is not enough. I will pray for your happiness, health and prosperity. May Almighty shower his choicest blessings upon you always.
With Best wishes
Jamila
Sri Lanka
Thanks for sharing your results, Jamila. That’s a great score. You should be proud 🙂
Does bad handriwriting lead to low marks? I am quite bad at it . Punctuation is also a place where i lack.
If the examiner can’t read your writing, then it’s a problem. Punctuation is part of the grammar score.
Hi Liz…. how can i get more of this model answer??… i looking for them in your belog but i can’t found anything, just ideas….(sorry for my bad grammer…)
See the main writing task 1 page. Each of the main writing pages contain model answers – look at the red nav bar.
Thanks a lot…
will have been increased i mean
Please Liz, I wounder if you could help me to find website for assessment my writing,my exam on 4.JUNE , I expect your sooner help,
https://ieltsliz.com/ielts-essay-correction/
Thank you very much, I would like to ask about samples of letters also in your website,are those for candidates with high score or those for your esteemed side,as I want to be referred to the best side.
Really, I could not express my gratitude for you
I don’t understand your comment. Academic IELTS students do not write letters for writing task 1.
Thank you!
Good Luck..
Dear Liz,
Could you give me some advice about my essay?
Thank you so much.
Regards
The table gives information in relation to the ageing population in Canada, Germany and Britain in three different times.
Overall, in all countries, the proportion of people aged 65 or more increased and will continue to rise over the period shown. Germany had the highest percentage of older population, and the same is predicted for the year 2030 while the least proportion can be seen in the UK in the same period.
In 1988, the proportion of elderlies was higher in Germany (20.45%), while the figures were comparatively lower in both Canada (16.32%) and England (14.23%), but quite similar percentages. By 2000 a steady increase in the proportion of older population could be seen in both Canada and Germany, rising by around 4%, at 20.67% and 25.32% respectively, whilst the rise in the UK was marginal.
By 2030, the ageing population is predicted to increase, with a noticable growth of approximately 5% in all three countries. Germany is expected to have the highest rate of 30.42%, followed by Canada(26.25%) and the UK (20.35%).
It’s very good. Never miss the dates in your introduction. The introduction is there to introduce facts, so don’t leave them out. Also be careful with vocab “elderlies” is not appropriate. Well done!
Dear Liz,
You are right and thank you so much for your encouragement, I really like the way you develop the essays, especially model essays of task 2.
Thank you for helping us.
Regards
Winnie
Hi Liz when i make IELTS academec test my score in reading was 4 that’s very bad score
can you help me to improve my reading skills and get score 7 ?
See this page: https://ieltsliz.com/ielts-reading-tips-how-can-i-improve-my-score/
Thanks Liz
good
First and foremost Thank You for these useful informations ……I face only one problem when there are so many figures in chart or grap like i done today then its become difficult too complete it in 150 words because some information always left if care about word limit if not then the word limit exceeds :/
Dear Liz :
At first I acknowledge your obligation and thank you so much for your tips. u know i have been doing an MBA at University of Development Alternative in Bangladesh. also I have been doing IELTS from British Council. I am always try to complete my task as per your advice.
Thanking You
Muktar
Dhaka, Bangldesh
Dear Liz,
I would be grateful to you if you could assist me in one question….sometimes in listening answers we write an optional answer in bracket …..would that be correct or wrong? …. for example if the answer is cabs….and we write cab (s) then would it be correct or wrong ?
https://ieltsliz.com/ielts-listening-for-plurals-tips-practice/
Your works are inspiring, may the Almighty God bless you.
hi liz
i need really need teacher who helps me to succeed in the IELTS if you find let me know and thank for me much to help us
I don’t have a list of teachers but you can try my advanced writing task 2 lessons to start: http://subscriptions.viddler.com/IELTSLizStore
Thanks a lot LIZ for the post. I have some query.
Can I use the word ‘Senior Citizen’ instead of using ‘the aged 65 or more’ in some cases?
Thanks in advance .
I wouldn’t use that paraphrase for this task.
Hi liz , can you help me and tell me from where should I start to study, it will be the first exam . I hope to get high grade.
Thank you.❤
Watch my IELTS preparation video on my home page: https://ieltsliz.com/. Then read about the test information: https://ieltsliz.com/ielts-help-faq/. Then do a practice test to check what the exam is like (do it under exam conditions): https://ieltsliz.com/useful-websites-and-resources-for-ielts/. Then review your results and start planning how you want to focus on your training.
Thanks Liz for sharing your model answer. I have been looking for it.
May I have a quick question? In the last sentence of the last paragraph, would that be possible for me to write “The percentage is forecasted ….” (NOT forecast).
Thanks again for all of your great work here. They all have been very helpful to me.
It isn’t a regular verb: http://www.verbix.com/webverbix/English/forecast.html
thank you so much Liz,really enjoying your tips as i prepare for my academic exams in June
Maam liz, why is that the model answer has no conclusion? Is it allowed without conclusion?
See this video: https://ieltsliz.com/ielts-tips-conclusion-or-overview-for-writing-task-1/
Hi Liz!
First of all ,thanks for all the hard work you do for us.
I had a question. By adding “Overall” in front of overview ,aren’t we using a memorised word every time?
It is a connective device which indicates to the reader the content of the paragraph. Without such linking words, you will get a low score. 25% of your marks is based on paragraphs and linking words.
Thank you so much!My examination is tomorrow and i have been studying through your website only. I will post the questions I remember tomorrow positively.
Good luck!
Thanks liz
My answer for this graph… Could you give feedback ?
The table given demonstrates the proportions of elderly in three countires; Germany, Canada and the UK in 1980 and 2000 and it also shows the predictions in 2030. Overall, it can be clearly seen from the table that the population of aged 65 and over has been increasing in these three counties.
First of all, in 1988, the percentage of old people in Germany was more than other countires with 20,45%. That of in Canada and the UK was 16% and 14% relatively. In 2000 the rates of Canada and Germany increased by approximately 5% whereas there was no significant change in the rate of elderly in the UK. The gap between Canada and the UK’s aged population went up in 2000. On the other hand, it is predicted that the number of aged 65 and over will rise in 2030. The proportions will go up by about 6 points and will reach 26%, 30%, 20%. The population of aged in Germany will remain the highest in the graph.
To sum up, the quantity of old people will be increasing gradullay in these three countires in 2030. Populations will have became more older.
Dear liz, thank you for helping ielts students like me. God bless you?
Thank you dear liz
This information really usful for students who are going to give ielts test tomorrow.thanks dear mam
Good luck!
DEAR LIZ, you have written “continue remain” while writing overview of the given table.should’nt it be “continue remaining” (a verb followed by adjective), “the highest proportion of older people was in Germany,which will continue remaining the highest in 2030” or which will continue to remain the highest .regards
Very well spotted 🙂 I’ve just altered it.
Dear Liz,
You are graet teacher.Thank you for your good work.
With the best regads
Z.k
Hi Sunita, I will give the ielts Tomorrow too 😉
good luck 😉
Thank you teacher Liz.
Thank you Liz. These lessons are really of big help.