This lesson focuses on improving your IELTS writing task 1 introduction for the academic paper. To write an introduction you must paraphrase and re-write the information given by IELTS about the chart of graph.
Below is a sample line graph sent to me by an IELTS Candidate.
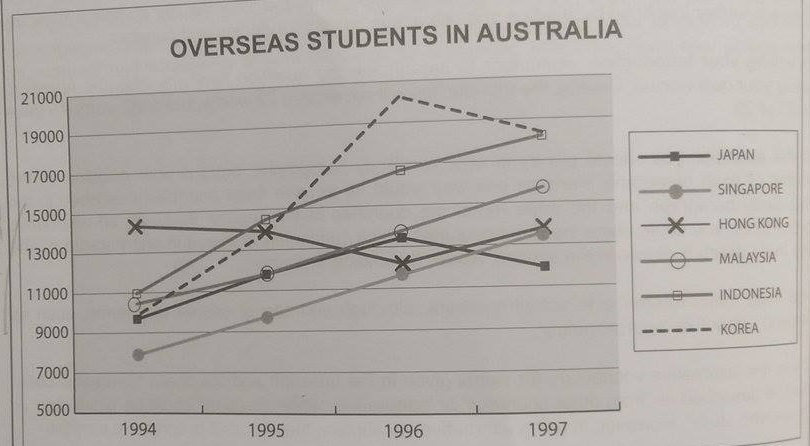
The line graph below shows the number of overseas students who came from six Asian countries to study in Australia from 1994 to 1997.
Source: Graph above was not created by IELTS Liz.
Introduction Paragraphs for Writing Task 1
Below are two introductions written by the IELTS candidate. Would you use one of these introductions or would you write a different introduction?
Introduction 1: The diagram shows the amount of students from six different countries in Asia, who came to study in Australia between 1994 and 1997.
Introduction 2: Between 1994 and 1997 the number of Asian students from six different countries, who came to study in Australia.
Questions:
- Do they cover all the necessary information?
- Are there any errors in them?
- How you would write your introduction to the line graph above?
- How many paragraphs would you have for your complete report for the above line graph?
Feel free to post your answers. However, please note I do not common on writing.
Answers and Model Introduction
Complete the questions above. Then click below to reveal the answers and model introduction paragraph.
Answers & Model Introduction- They both cover most of the important information. However, they are lacking the list of countries. Where possible include the list, unless it is too long.
- Errors:
- A line graph is a line graph. Those words should not be paraphrased.
- Always try to paraphrase the verb “shows”.
- The word “amount” is for uncountable nouns, not for countable nouns. We can use this word with “people” or “students”. See this page: Uncountable Nouns
- See the model answer below:
- The line graph illustrates how many students from six different countries in Asia (Japan, Singapore, Hong Kong, Malaysia, Indonesia and Korea) went to Australia to study over a period of four years between 1994 and 1997.
- How would you organise your task 1 writing for the above line graph? How many paragraphs would you have? What information would you put in the body paragraphs?
You should have 4 paragraphs: introduction, overview, body paragraph A and body paragraph B.
In body paragraph A, you can put information about Singapore, Malaysia, Indonesia and Korea. In body paragraph B, you can put information about Japan and Hong Kong because they showed different trends from the others.
.
IELTS Writing Task 1 Free Lessons & Tips
Click below to open all my free lessons and tips for task 1:
IELTS Writing Task 1 Free Lessons
………………..
Subscribe for Free to get New Posts by Email


The line graph illustrates foreign students studying in Australia between 1994 and 1997, that were from six different Asian countries. The Asian countries represented were Japan, Singapore, Hong Kong, Malaysia, Indonesia, and Korea.
All the countries except Hong Kong had an increase in the number of students coming to study in Australia, from 1994 to 1996. After 1996 the number of students traveling from Korea and Japan to Australia to study decreased in number, while those from the remaining four Asian countries increased.
In 1994 the highest number of overseas students were from Hong Kong, as these were close to 15000 in number, whereas those from the other Asian countries ranged from about 8000 to 11000 in total from each country. This was followed by a steady growth in the number of students from each of the countries except Hong Kong, with the number for students from Korea peaking up to almost 21000 in total, whereas those from Hong Kong decreased to around 13000 in 1996.
However, between 1996 and 1997 the total of overseas students continued to increase, with the exception of Korea and Japan. Despite the decline in the number of overseas students from Korea, Korea and Indonesia had the highest number of overseas students with a total of approximately 18000 students each compared to the other Asian countries whose number of students ranged from about 12000 to slightly above 15000.
The line graph illustrates the number of international students who joined australia’s universities/colleges from 6 different asian countries (Japan,Singapore,
Hongkong ,Malasiya,Indonesia and korea) between 1994 and 1997
Here is my answer:
The line graph illustrates how many students who came from six different countries (Japan, Singapore, Hong Kong, Malaysia, Indonesia and Korea) to study in Australia between 1994 and 1997.
The line graph illustrates how many students attended to Australia in the purpose of study from six Asian countries between 1994 and 1997.
Hello Ma’am,
It’s been a first query of mine on this website. It will be very helpful to me if you reply on this as my exam is on 23rd November 2019.
I have written below Introduction of this line graph. Please evaluate it and let me know my mistakes.
Thanks a lot in advance
“The graph illustrates the number of international students between 1994 and 1997, who came from six different countries (Japan,…………………….) to study in Australia.”
Waiting for your kind reply.
Here is my answer
The six lines graph compares the amount of puplis who came from six Asian countries from 1994 to 1997 to study in Australia. Overall, the amount of the students increased over the given period particularly from Korea and Indonesia.
As is presented, Singapore, Malaysia and Indonesia have an identical trend, they stood at 11000, 10500 and 9800 respectively. A dramatically improve in the number of Indonesia students is recorded to peak at 18200.while, Malaysia and Singapore showed a gradual growing to end up with 16000 and 13800 regarding.
Although Korea and Japan have both started from 9800 in 1994, Korea flourished remarkably to reach the trough of 20000 in the mid of 1996 whereas Japan was just above 13000, 1997 witnessed fall down.
In contrast, Hong Kong remained steadily above 14000 despite the downward of the mid 1996.
Your reply is highly appreciated 😊
Dear Liz,
In your usual kindness, do please help me check my take on this. I will be glad to read your comment as it will aid my improvement.
Thank you
Chinenye
The line graph illustrates how many students from six Asian countries ( Japan, Singapore, Hong Kong, Malaysia, Indonesia and Korea)that traveled to study in Australia from 1994 to 1997.
Overall, Korea citizens formed the highest population of Asian students in Australia while Singapore accounted for the least. Furthermore, there was a continuous increase of students from Asian continent over the period given.
Singapore and Malaysia started off at about 7,500 and 9,500 students in 1994 respectively and they both recorded steady increase of about 2,000 students per year, while the Indonesian population increase for the four year period fluctuated within the range of 2,000 to 3,800.
In addition, Korea and Japan students were about 9,500 in 1994, climbed rapidly and peaked at above 20,000 and 13,000 before a sharp decline to slightly above 18,000 and 12,000 in the final year respectively. On the other hand, students from Hong Kong were above 14,000 in the first year, decreased to 12,500 in 1996 before an upward surge to shortly below 14,000 at the end.
Just to share my answers with others, here is my answer after the introduction. From what I learned from the other posts, I need to cover most of the information in the graph, but it exceeds 190. Any ideas?
Overall, there was an increase in the number of studnets from four countries (Malaysia, Korea, Indonesia and Singapore) while the figure dropped over the frist three years regarding Hongkong and Japan.
There was constant increase in Malaysian students to around 16000. Similarly, the number of students from Indonesia and Singapore rose gradually over given period. However, the number of Singaporean students was the lowest at around 8000 in 1994 while Indonesian students were the second largest number of 110000 at the start of the period. Regarding Korean students, it began at around 10000 and rose dramatically by double in 1996. From that point, the figure dropped slightly the next year.
On the other hand, there were the most students from Hongkong in 1994 and this figure fell gradually in the following three years before increasing to around 14000 in 1997. There were just over 9000 Japanese students in 1994 and it increased constantly to a high of approximately 13500 in 1996, which then declined to 12000 at the end of the period.
Hello Mam,
It been my first qerry ever in this website. I would like to know about short and quick writing tips for both the tasks. How would I decorate my writing tasks I & II with the use of lucrative vocabs ? Is there any marks deduction on handwriting ? Please enlighten me on this part, because my exam is on 2nd august 2018.
I need your assistance for other sections too.
Regards
UDIT
There are lots of pages of free information, advice and tips on this site. See these pages: https://ieltsliz.com/ielts-writing-task-1-lessons-and-tips/ and https://ieltsliz.com/ielts-writing-task-2/ and https://ieltsliz.com/ielts-help-faq/
You should not be filling your writing with descriptive language. You should use appropriate language. For Writing Task 2, I suggest you get my Ideas for Topics E-book which contains both ideas and vocabulary for over 150 common topics, see my online store. Click here: ONLINE STORE